Using AI to Keep Up With My Investment Portfolio
How I built a weekly briefing system with Claude Code that researches my holdings and tells me what actually matters
February 2026
The problem with staying informed
I've been investing for a few years now, mostly as a passive, long-term investor. Over time, I've diversified across different industries, countries, and currencies. A mix of ETFs, a couple of individual stocks, and a managed fund. Some safer, some higher risk.
The problem? Keeping up with all of it is genuinely hard. Each holding has its own earnings calendar, its own industry dynamics, its own set of risks. When you're spread across multiple sectors and exchanges, the amount of news and data you need to process each week is overwhelming.
I found myself doing one of two things: either spending hours every weekend manually checking Yahoo Finance, reading earnings reports, and Googling each company, or (more honestly) just not keeping up at all and hoping nothing important slipped through.
Neither felt great. So I thought: what if I could get Claude Code to do the research for me and just give me a weekly summary of what actually matters?
What I wanted
The idea was simple. I wanted a personal investment analyst that could:
- Fetch live price data for all my holdings across different exchanges and currencies
- Search for material news on each one (earnings, leadership changes, regulatory moves, geopolitical events)
- Check each piece of news against my investment thesis for that holding, so it can tell me whether something is just noise or actually worth paying attention to
- Flag things clearly with a simple signal system: all clear, watch, or action needed
- Translate technical financial metrics (like P/E ratios, dividend yields, 52-week ranges) into plain language about what they mean for my specific holdings
- Track developing situations week over week, so nothing gets forgotten
As a novice investor, that last point was really important to me. I don't always know what a metric means or whether a number is good or bad in context. Having the system explain "this P/E ratio is high relative to the sector average, which means..." helps me learn as I go, rather than just staring at numbers.
How I set it up
The whole system is a Claude Code project with a few simple pieces that work together:
A JSON file with my portfolio
Each holding has its ticker, how many shares I own, and crucially, my investment thesis. Why I bought it, and what would make me reconsider. This is what lets the AI filter signal from noise. A 5% weekly drop is just volatility, but a company pivoting away from its core business? That's an action item.
A price fetcher
A small Python script that pulls live price data for all my holdings. Current prices, weekly changes, 52-week ranges, dividend yields, P/E ratios. It handles the fact that my holdings are on different exchanges in different currencies, so I don't have to think about that.
An event calendar
A JSON file that tracks upcoming events (earnings dates, dividend ex-dates, regulatory deadlines) and carry-forward items from previous reports. This is what gives the reports continuity. If something was flagged last week, it shows up again this week with an update.
Instructions for Claude Code
A detailed instruction file that tells Claude Code exactly how to research each holding, what sources to check, how to structure the report, and how to apply the three-tier signal system. It also specifies the output format: a clean, mobile-friendly HTML report with color-coded badges that I can open in a browser.
My weekly routine
Every week, I run three commands. First, it generates a research plan based on my portfolio weights and upcoming events. Then it fetches fresh price data. Finally, I tell Claude Code to generate the weekly briefing, and it goes out, searches the web for news on each holding, cross-references everything against my investment theses, and produces the report.
The whole process takes about 10 to 15 minutes, most of which is Claude Code doing its research. I just kick it off and come back to a finished report.
What I get back
Each weekly report includes:
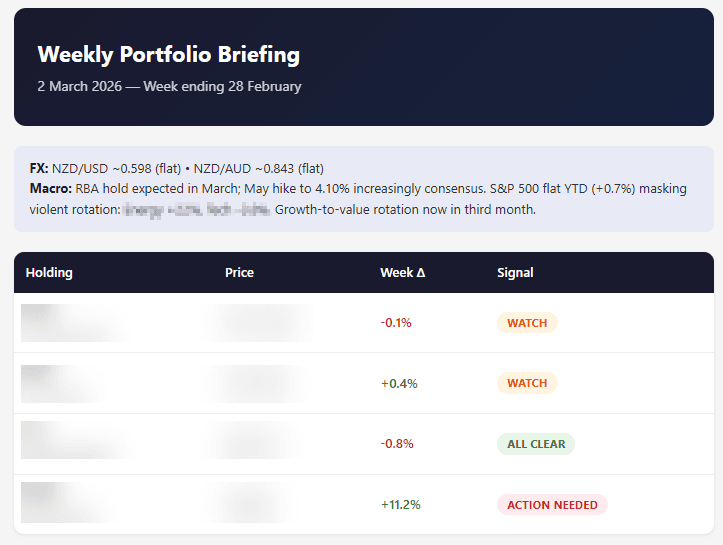
- A portfolio summary table with all holdings, current prices, weekly changes, and a signal badge for each (green for all clear, amber for watch, red for action needed)
- A detailed section for each holding covering material news, price and valuation snapshot, and a thesis check
- A sector and macro overview that groups holdings by theme, so I can see broader patterns (like how a geopolitical event might ripple across multiple holdings)
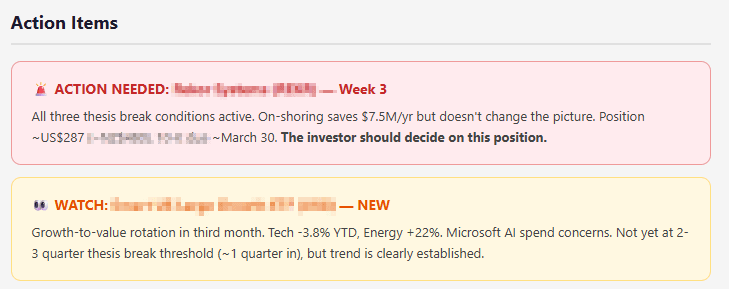
- A clear action items section with only the things that need my attention, along with suggested next steps
The output is a self-contained HTML file with inline styling, so I can just open it in a browser. Clean cards, color-coded badges, works nicely on mobile too.
Where it actually helped
Over about 5 weeks of reports, the system caught things I definitely would have missed if I was doing this manually (or more realistically, not doing it at all):
- One of my holdings had a going concern warning flagged in their quarterly filing. On its own, that's already concerning. But the system also picked up that the CFO had recently departed, and the company was pivoting into a completely different market. Because the system tracks these things week over week, I could see the situation escalating over 4 weeks, each report building on the last. That gave me the context to make an informed decision about whether to hold or exit.
- Another holding got upgraded from "watch" to "all clear" after a strong half-year result, which was reassuring to see confirmed rather than just hoping things were fine.
- When a major geopolitical event happened, the report showed me exactly which of my holdings were affected and how, grouped by sector. I didn't have to figure out the connections myself.
The key thing is that it provides me with the highlights, the news, and the sources. Based on that, I make the decision myself about whether something is concerning and requires action. It doesn't tell me what to do. It tells me what I should know.
Why the investment thesis matters
The thing that makes this actually useful (rather than just a news aggregator) is the investment thesis filter. For each holding, I wrote down why I bought it and, more importantly, what would make me reconsider.
So when Claude Code finds a piece of news, it doesn't just say "here's what happened." It checks: does this affect the reason I own this? A stock dropping 5% in a broad market sell-off is noise. The same stock dropping 5% because they're losing market share in the exact thing I bought them for? That's a signal.
This distinction between signal and noise is what I struggled with most as a beginner investor. Everything feels important when you don't have a framework. The thesis gives the system (and me) that framework.
What I learned
About investing
- What P/E ratios, dividend yields, and 52-week ranges actually tell you in context
- How to think about portfolio diversification across sectors and currencies
- The difference between noise and signal in financial news
- Why writing down your investment thesis forces clarity
About building with AI
- Claude Code can do genuine research, not just summarize what you give it
- Good instructions make all the difference in output quality
- Iterating week over week is how you refine a system like this
- The carry-forward pattern (tracking things across sessions) is powerful
Honestly, the biggest thing I got out of this project wasn't the reports themselves. It was that building the system forced me to think more clearly about my investments. Writing down a thesis for each holding, defining what would make me reconsider, thinking about sector exposure. The process of setting it up taught me more than months of passively holding.
Wrapping up
This started as a weekend experiment and turned into something I genuinely rely on. Every Sunday, I get a briefing that tells me what happened across my portfolio, what it means for my investment theses, and what (if anything) I should pay attention to.
As a novice investor, having something that translates raw financial data into plain language and checks it against my own reasoning has been incredibly valuable. I'm learning more about my holdings every week, and I'm not missing things that matter.
If you're someone who invests across multiple holdings and finds it hard to stay on top of everything, something like this is very doable with Claude Code. You don't need to be a developer. You just need to know what you want to track and why you own what you own.